Majorbird MES · لوحات المعلومات
راقب الخط أثناء تشغيله.
تتحول البيانات التي تجمعها أرضية المصنع إلى صورة حية للإنتاج: العائد، والمعدل، وحالة المحطات، وسجل الوحدات، تُحدَّث لحظة بلحظة أثناء عمل المشغلين، على أي شاشة من مكتب المشرف إلى لوحة كبيرة فوق الخط.
احجز عرضا توضيحيا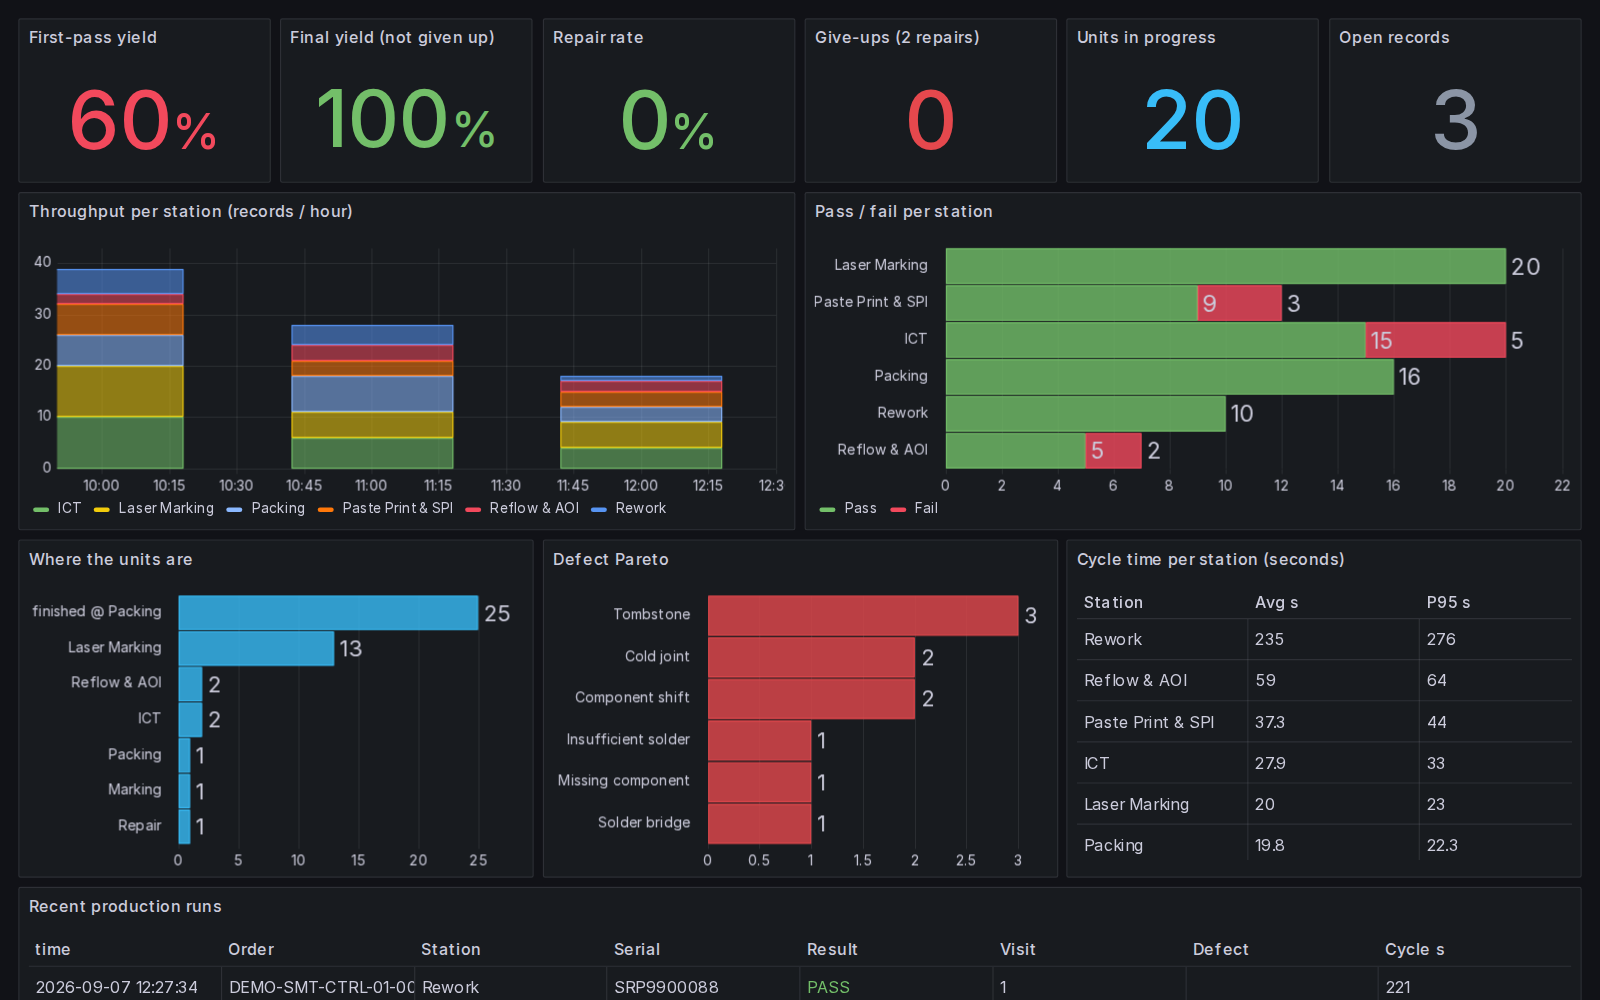
المشكلة
يخبرك التقرير الأسبوعي أين كنت، لا أين أنت الآن: وبحلول وقت ظهور أي تراجع، تكون آلاف الوحدات الإضافية قد شُحنت بالفعل.
ما الذي يقدّمه Majorbird MES
يظهر أي توقف أو تراجع في العائد فورا، فيصلحه المشرفون بينما لا يزال الأمر مهما، بناء على أرقام حقيقية مباشرة من أرضية المصنع.
لماذا يهم هذا
العائد في لمحة
العائد من أول مرة، والعائد النهائي، ونسبة الإصلاح.
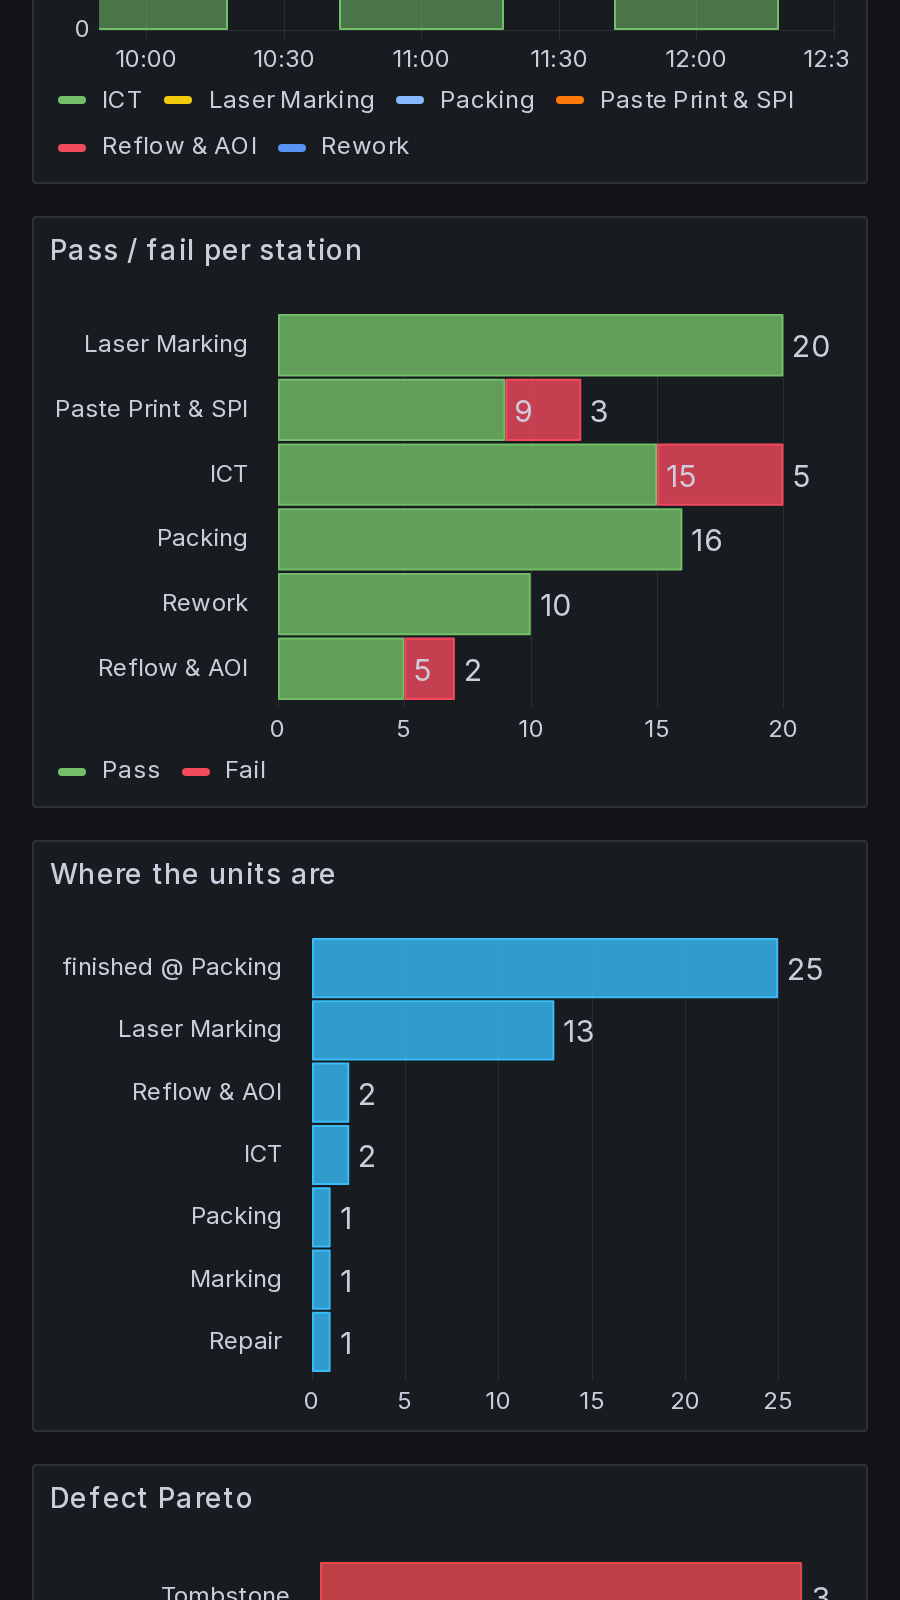
النجاح/الفشل وتحليل باريتو للعيوب
النجاح والفشل لكل محطة وأبرز أسباب الفشل، فيتضح فورا أي فحص يسبب المشكلة.
الإنتاجية والعمل قيد التنفيذ وزمن الدورة
عدد السجلات في الساعة لكل محطة، وأين توجد كل وحدة الآن، ومتوسط الزمن وأسوأ زمن لكل محطة.
لكل أمر ولكل وحدة
عرض حسب الأمر وعرض حسب الوحدة، مع التصفية برقم الأمر أو الرقم التسلسلي، إضافة إلى عرض مباشر لكل آلة متصلة.
كيف يتلاءم مع نظامك
مبني على Odoo: يعمل داخل نظام Odoo ERP لديك، أو كنسخة مستقلة متزامنة مع ERP الخاص بك. لا شيء يُستبدل.