Data is only valuable when it can be understood and acted upon. The right tools turn endless rows of numbers into insights that drive strategy, uncover problems, and reveal opportunities.
Metabase, Grafana, and Mermaid each play a role in making that happen—fast, clearly, and without unnecessary complexity.
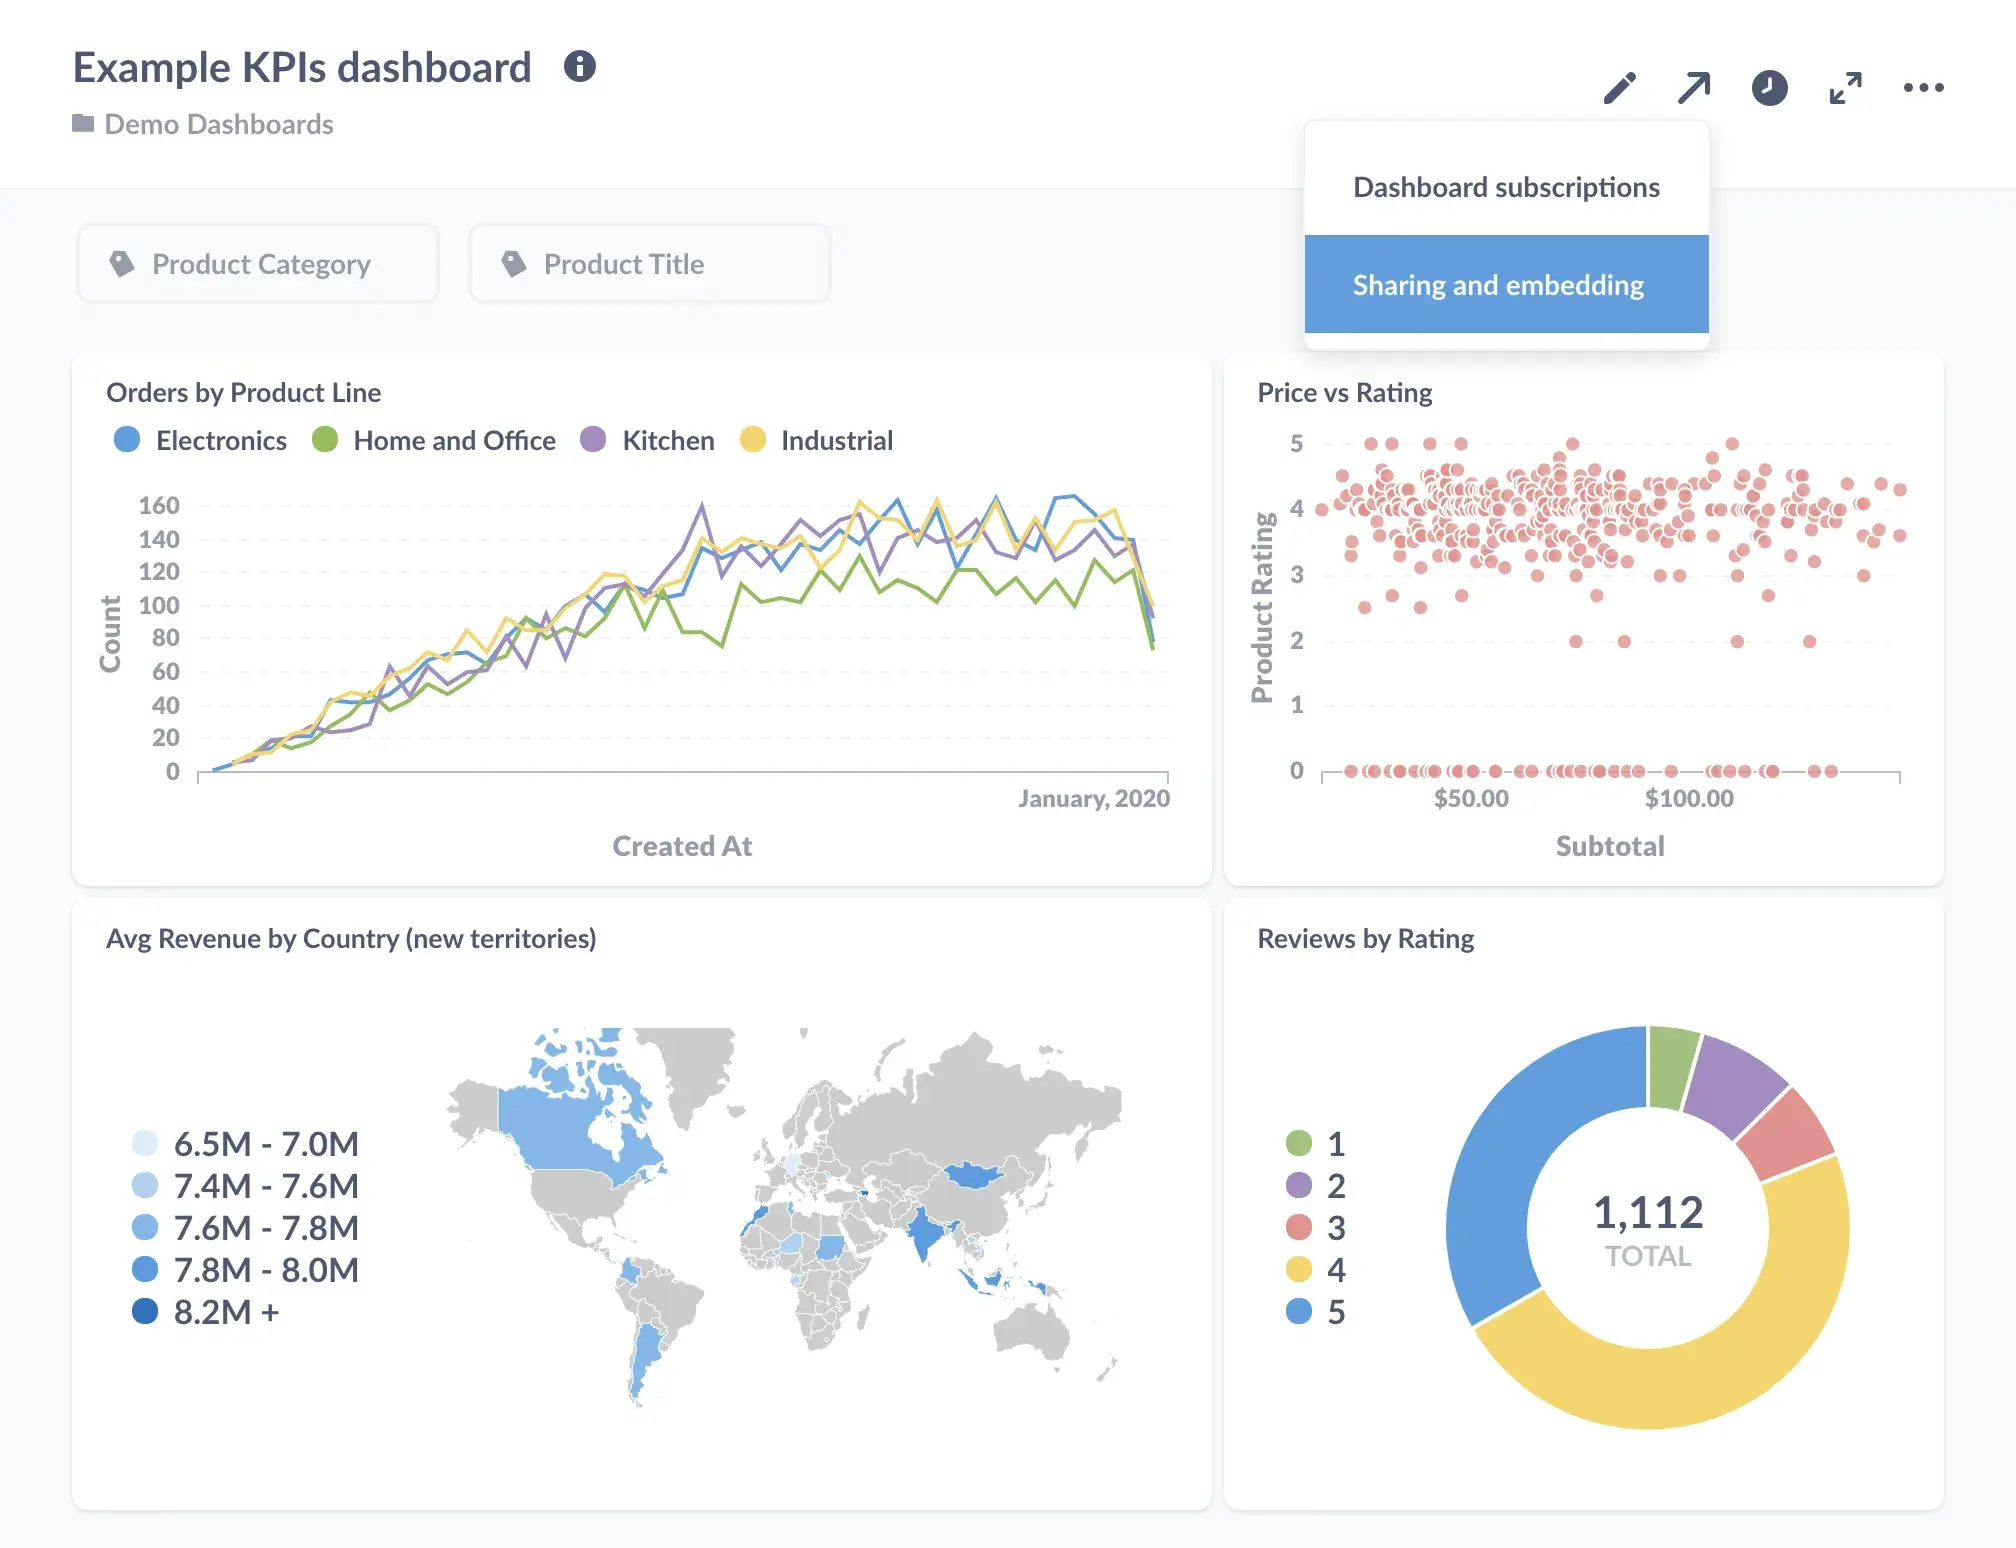
Metabase – Fast, Simple, Actionable
Metabase is an open-source business intelligence platform designed for simplicity. It connects directly to databases and lets teams create dashboards, charts, and reports without writing a single line of code.
- Why it works: Speed to insight. Questions can be answered in minutes, not days.
- Why it’s adopted: Accessible to non-technical users, yet powerful enough for data teams.
Grafana – Real-Time, Technical, Reliable
Grafana specializes in real-time visualization. It’s widely used to monitor infrastructure, application performance, and IoT devices.
- Why it works: Exceptional for time-series data, alerting, and long-term monitoring.
- Why it’s adopted: Its plugin ecosystem and flexibility make it a go-to for DevOps and industrial monitoring.

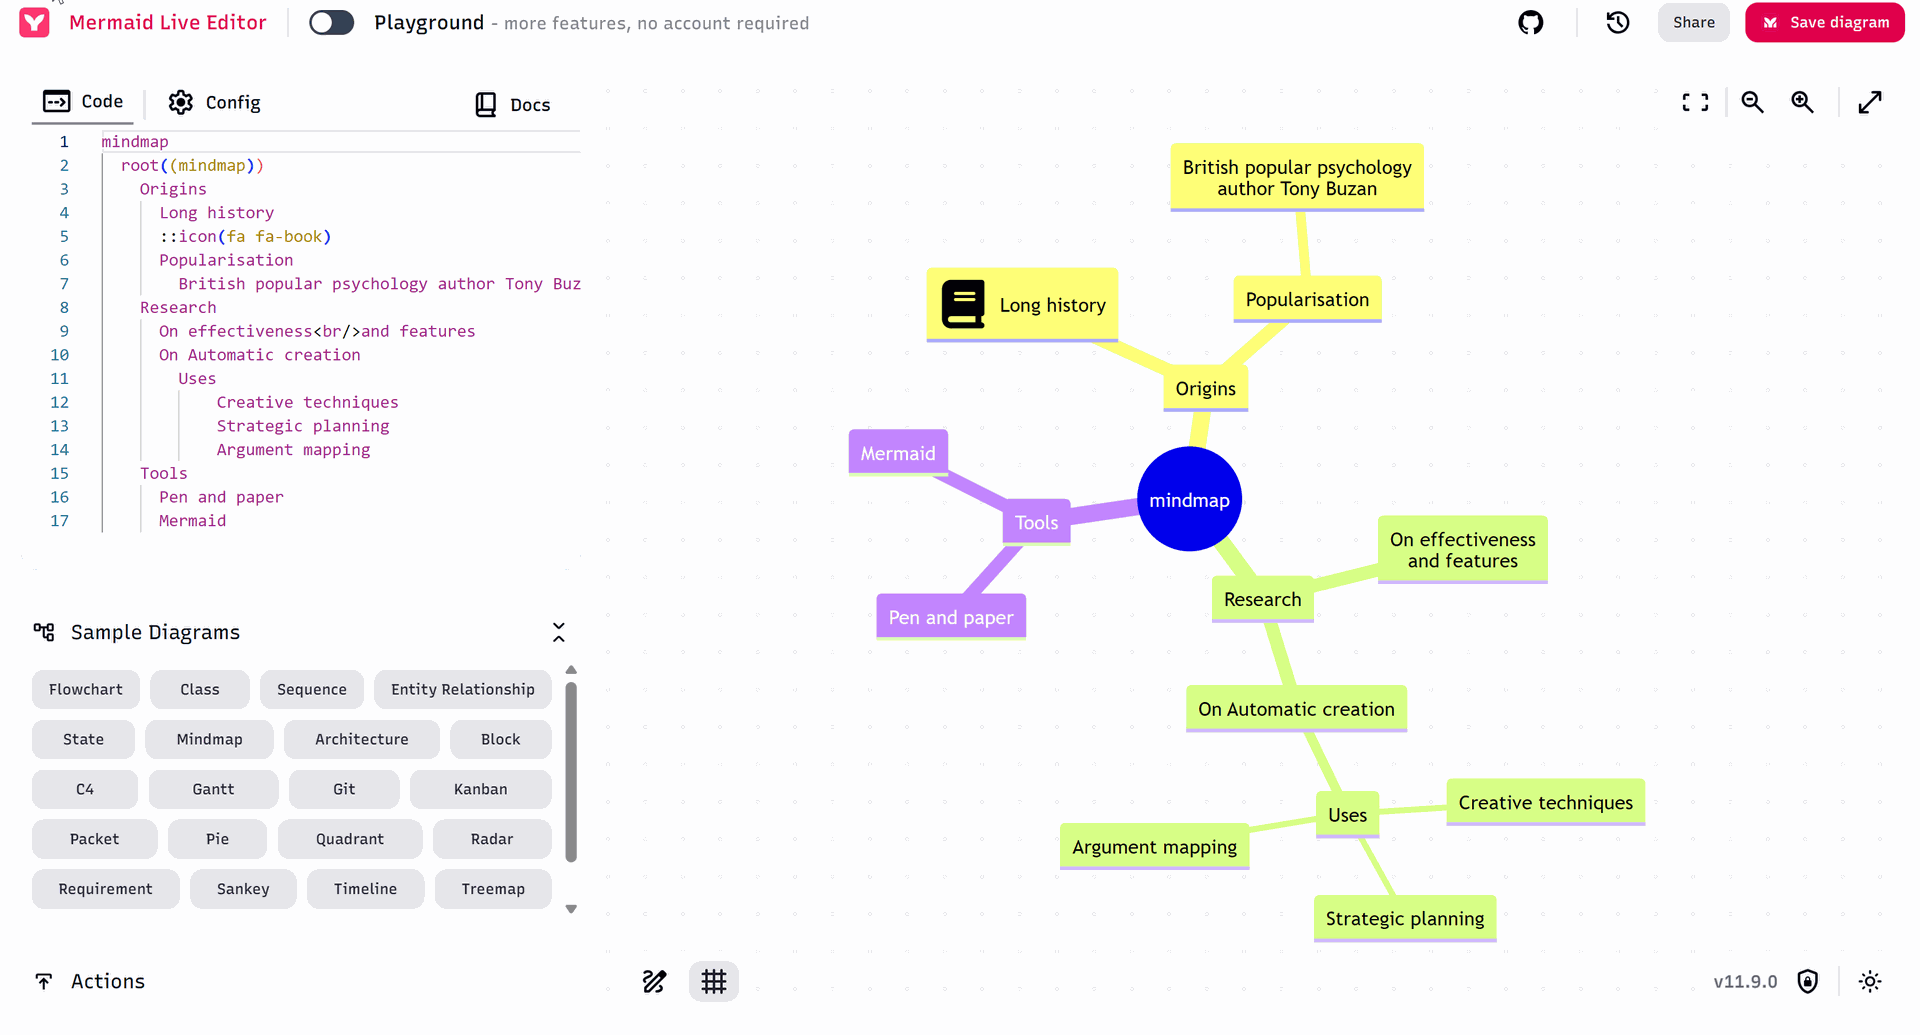
Mermaid – Visuals for Complex Processes
Mermaid isn’t a dashboarding tool—it’s a way to draw diagrams from text. Flowcharts, sequence diagrams, Gantt charts, and more can be generated directly from simple syntax.
We mostly use it to convert AI text answers to charts in documents or conversations.
- Why it works: Perfect for documentation, process mapping, and system design.
- Why it’s adopted: Lightweight, open, and easy to integrate into wikis, Git repositories, and technical documents.
Why Use All Three
No single analytics tool fits every situation. Metabase excels at business reporting, Grafana handles live operational monitoring, and Mermaid captures processes visually.
Using them together means decisions are informed by:
- Clear business KPIs
- Accurate real-time operational data
- Understandable process diagrams
Why not use Odoo for BI?
In fact most our customers use Odoo BI tools on a daily basis: the default list/pivot views of Odoo are the most dynamic and flexible way to get data on a day to day basis.
Odoo Spreadsheet also provides great capabilities by fetching data from the database in an excel like format.
This said, some of the industry leaders like PowerBI, Metabase, Graphana and Tableau still offer some great advantages:
- Richer charting engine
- Native connectivity to most database/protocols for database and streams
- SQL like query engines made non-technical*
- Ability to share live dashboards to external shareholders
- Dashboard as a datasource for another dashboard
- And more.
The decision to use one of these tools over Odoo should be thought over, as it would add dependencies to another system. We usually would recommend these tools when:
- Dashboards with complex queries are required (multiple datasources)
- Live data stream is needed (IOT/MQTT etc.)
- Dashboards need to be shared as a stand alone application without a Odoo user (external shareholders)
- Most MES implementations we have done would use such tool
- The looks of the dashboard needs to be more than excel-like
The Result
A data landscape that is easy to navigate. Executives, engineers, and analysts all get the view they need—without fighting the tools. Insights move faster, decisions improve, and teams stay aligned.